Researchers in our Office of Disability Employment Policy recently analyzed workforce data on American Indian or Alaska Native representation in various industries and occupations. This is the latest in an ongoing series of data snapshots about different subgroups of disabled people. Previous snapshots explored Hispanic workers with disabilities, Asian Americans and Pacific Islanders with disabilities, Black workers with disabilities and Women with disabilities.
Unless otherwise noted, the data below reflect the authors’ calculations using the Current Population Survey 2021 annual averages and include civilian, non-institutionalized American Indian or Alaska Native adults ages 16-64. We consider a person answering “yes” to any one of the six difficulty questions (hearing difficulty, vision difficulty, cognitive difficulty, ambulatory difficulty, self-care difficulty and independent living difficulty) to have a disability.
Over 500,000 working-age American Indian or Alaska Native adults in the United States have a disability.
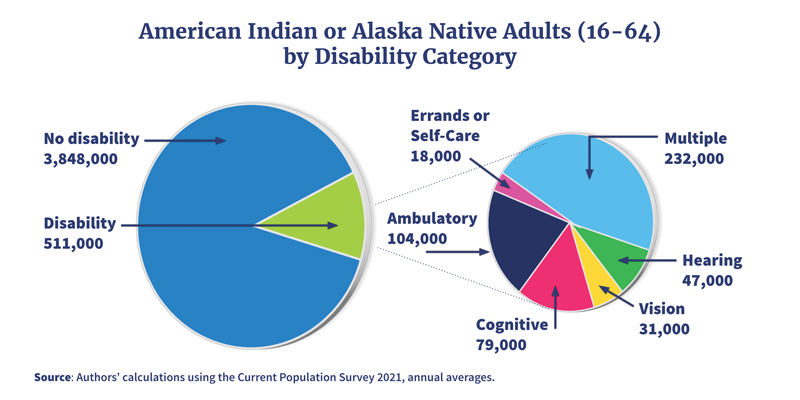 Approximately 511,000 American Indian or Alaska Native adults have at least one disability. Approximately 279,000 have a single disability type. 232,000 have multiple disabilities. Of those with single disabilities, 79,000 have a cognitive difficulty, 104,000 have an ambulatory difficulty, 47,000 have difficulty with hearing, 31,000 have difficulty with vision, and 18,000 have difficulty with errands or self-care.
57% of working-age American Indian or Alaska Native adults with disabilities are multiracial and/or of Hispanic origin.
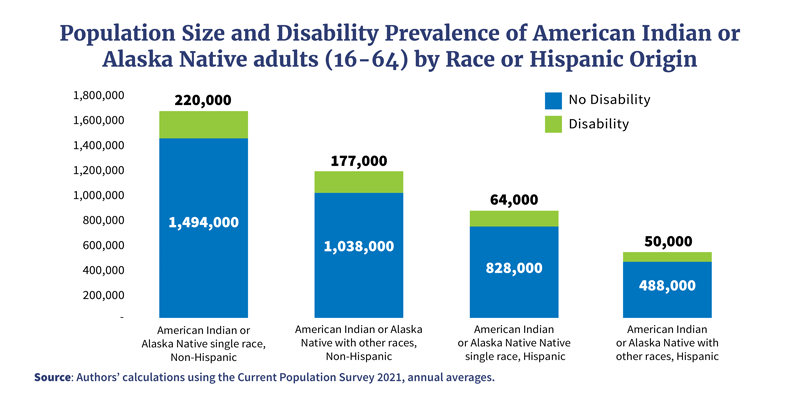 OMB Directive No. 15 Race and Ethnic Standards for Federal Reporting from 1977 specified the term American Indian or Alaska Native as one of the basic racial and ethnic categories for federal statistics. OMB’s Revisions to the Standards for the Classification of Federal Data on Race and Ethnicity from 1997 defines the category American Indian or Alaska Native to include anyone having origins in any of the original peoples of North America or South America. 220,000 American Indian or Alaska Native adults with disabilities report only that single race and non-Hispanic origin; 177,000 report that race in combination with multiple others and non-Hispanic origin, 64,000 report single race with Hispanic origin, and 50,000 report multiple races with Hispanic origin.
American Indian or Alaska Native women and men with disabilities (age 16+) are present in all stages of working life, with the highest numbers among those age 55+.
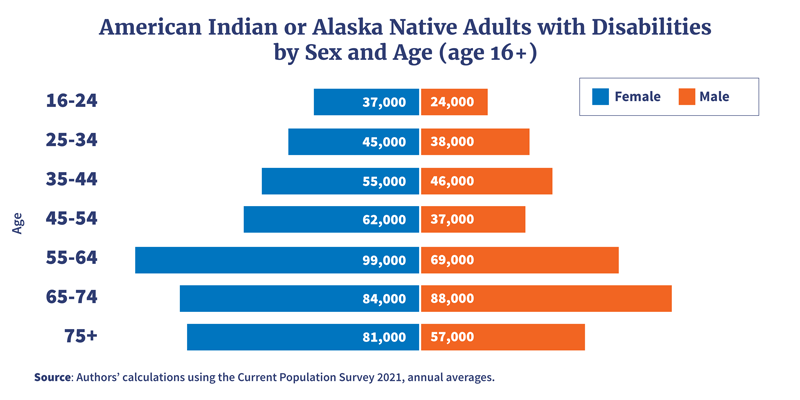
American Indian or Alaska Native Adults with Disabilities by Sex and Age – plain text
Approximately 237,000 American Indian or Alaska Native Adults with Disabilities (age 16+) are currently working or want to work.
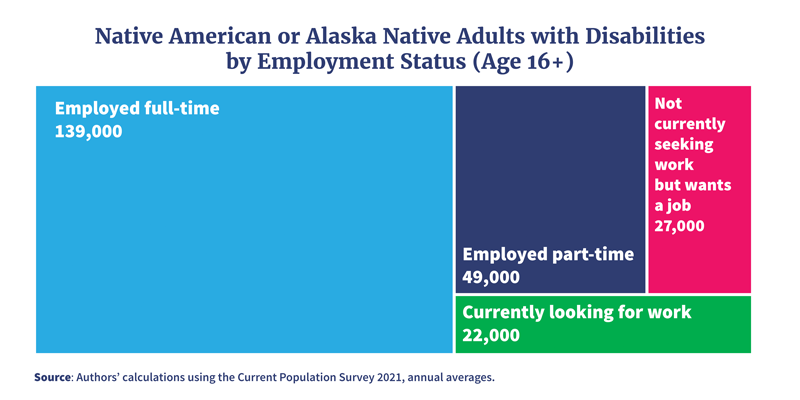 Approximately 237,000 American Indian or Alaska Native adults with disabilities are currently working or want to work. Approximately 139,000 are working full-time and 49,000 part-time. Additionally, 22,000 are currently looking for work and 27,000 are currently not seeking work but want a job.
Includes civilian, non-institutionalized, American Indian or Alaska Native adults with disabilities ages 16+.
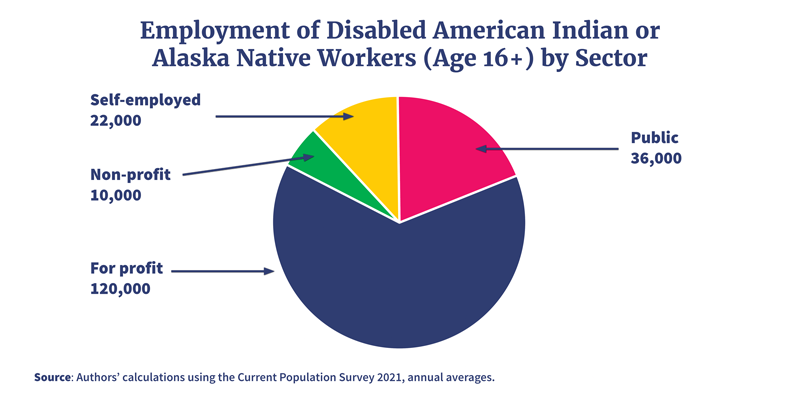
166,000 disabled American Indian or Alaska Native workers (age 16+) hold wage and salary jobs in the public, for-profit or non-profit sectors, while 22,000 are self-employed.
 Includes civilian, non-institutionalized, American Indian or Alaska Native workers with disabilities ages 16+. The self-employed are those who work for profit or fees in their own businesses, professions, trades or farms. Unless otherwise specified, CPS estimates of the self-employed published by BLS reflect only people whose businesses are unincorporated. In most CPS estimates, self-employed individuals working in incorporated businesses are classified as wage and salary workers because, technically, those individuals are paid employees of their corporations.
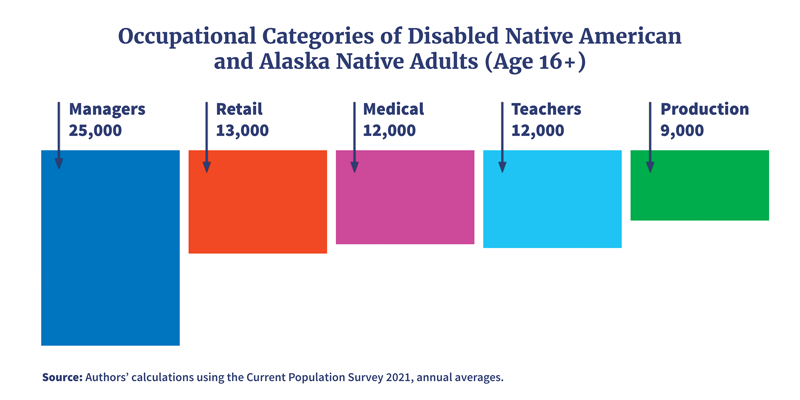
American Indian or Alaska Native adults with disabilities (age 16+) work in a range of industries, with the largest numbers in education and healthcare. They also hold a variety of occupations, including managerial positions, medical professions, retail, production and teaching.
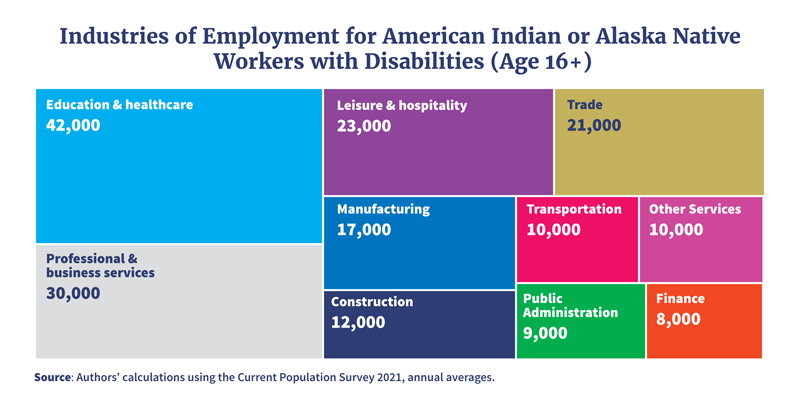 42,000 American Indian or Alaska Native workers with disabilities work in education and healthcare; 30,000 in professional and business services; 23,000 in leisure and hospitality; 21,000 in trade; 17,000 in manufacturing; 12,000 in construction; 10,000 in transportation and utilities; 10,000 in other services; 9,000 in public administration and 8,000 in finance. Not pictured: an additional 3,000 work in agriculture and 1,000 work in information.
Includes civilian, non-institutionalized, American Indian or Alaska Native workers with disabilities ages 16+.
 Includes civilian, non-institutionalized, American Indian or Alaska Native workers with disabilities ages 16+.
The Office of Disability Employment Policy promotes policies and coordinates with employers and all levels of government to increase workplace success for people with disabilities. ODEP's mission is to develop and influence policies and practices that increase the number and quality of employment opportunities for people with disabilities. For more information please visit: dol.gov/odep.
American Indian or Alaska Native Adults with Disabilities by Sex and Age – plain textAge RangeFemaleMale
| 16-24 | 37,000 | 24,000 |
| 25-34 | 45,000 | 38,000 |
| 35-44 | 55,000 | 46,000 |
| 45-54 | 62,000 | 37,000 |
| 55-64 | 99,000 | 69,000 |
| 65-74 | 84,000 | 88,000 |
| 75+ | 81,000 | 57,000 |
Original source can be found here.