The U.S. Census Bureau and the U.S. Bureau of Economic Analysis announced today that the goods and services deficit was $80.7 billion in December, up $1.4 billion from $79.3 billion in November, revised.
Three-Month Moving Averages (exhibit 2)
The average goods and services deficit decreased less than $0.1 billion to $75.5 billion for the three months ending in December.
- Average exports increased $7.1 billion to $225.6 billion in December.
- Average imports increased $7.0 billion to $301.2 billion in December.
- Average exports increased $39.4 billion from December 2020.
- Average imports increased $49.3 billion from December 2020.
Exports of goods increased $2.0 billion to $158.3 billion in December.
Exports of goods on a Census basis increased $2.2 billion.
- Consumer goods increased $1.2 billion.
- Pharmaceutical preparations increased $1.0 billion.
- Capital goods increased $0.9 billion.
- Civilian aircraft engines increased $0.6 billion.
- Automotive vehicles, parts, and engines increased $0.8 billion.
- Passenger cars increased $0.8 billion.
- Industrial supplies and materials increased $0.5 billion.
- Nonmonetary gold increased $1.2 billion.
- Natural gas liquids decreased $0.6 billion.
- Foods, feeds, and beverages decreased $1.1 billion.
- Soybeans decreased $0.5 billion.
Exports of services increased $1.4 billion to $69.9 billion in December.
- Transport increased $0.6 billion.
- Travel increased $0.5 billion.
Imports of goods increased $5.2 billion to $259.7 billion in December.
Imports of goods on a Census basis increased $5.3 billion.
- Consumer goods increased $5.2 billion.
- Cell phones and other household goods increased $2.4 billion.
- Toys, games, and sporting goods increased $1.0 billion.
- Household appliances increased $0.6 billion.
- Automotive vehicles, parts, and engines increased $2.4 billion.
- Passenger cars increased $1.4 billion.
- Other automotive parts and accessories increased $0.6 billion.
- Capital goods increased $2.3 billion.
- Telecommunications equipment increased $0.6 billion.
- Computers increased $0.5 billion.
- Industrial supplies and materials decreased $3.2 billion.
- Crude oil decreased $1.3 billion.
- Finished metal shapes decreased $0.7 billion.
- Fertilizers, pesticides, and insecticides decreased $0.7 billion.
Imports of services decreased $0.4 billion to $49.2 billion in December.
- Travel decreased $0.5 billion.
- Transport increased $0.1 billion.
The real goods deficit increased $1.3 billion to $111.2 billion in December.
- Real exports of goods increased $4.8 billion to $153.7 billion.
- Real imports of goods increased $6.0 billion to $264.9 billion.
In addition to revisions to source data for the November statistics, the seasonally adjusted goods data were revised for January through November so that the totals of the seasonally adjusted months equal the annual totals.
Revisions to November exports
- Exports of goods were revised up $0.3 billion.
- Exports of services were revised up $0.2 billion.
- Imports of goods were revised down $0.4 billion.
- Imports of services were revised up $0.1 billion.
The December figures show surpluses, in billions of dollars, with South and Central America ($5.4), Hong Kong ($1.9), Brazil ($1.2), Singapore ($0.8), and United Kingdom ($0.6). Deficits were recorded, in billions of dollars, with China ($34.1), European Union ($16.3), Mexico ($11.0), Germany ($5.3), Japan ($5.0), Canada ($4.2), India ($3.9), Taiwan ($3.8), South Korea ($3.7), Italy ($3.1), France ($0.8), and Saudi Arabia ($0.7).
- The deficit with China increased $6.0 billion to $34.1 billion in December. Exports decreased $2.2 billion to $11.8 billion and imports increased $3.8 billion to $45.9 billion.
- The deficit with South Korea increased $1.4 billion to $3.7 billion in December. Exports decreased $0.9 billion to $4.8 billion and imports increased $0.5 billion to $8.5 billion.
- The deficit with the European Union decreased $3.0 billion to $16.3 billion in December. Exports increased $0.7 billion to $25.1 billion and imports decreased $2.4 billion to $41.4 billion.
Exports, Imports, and Balance (exhibit 1)
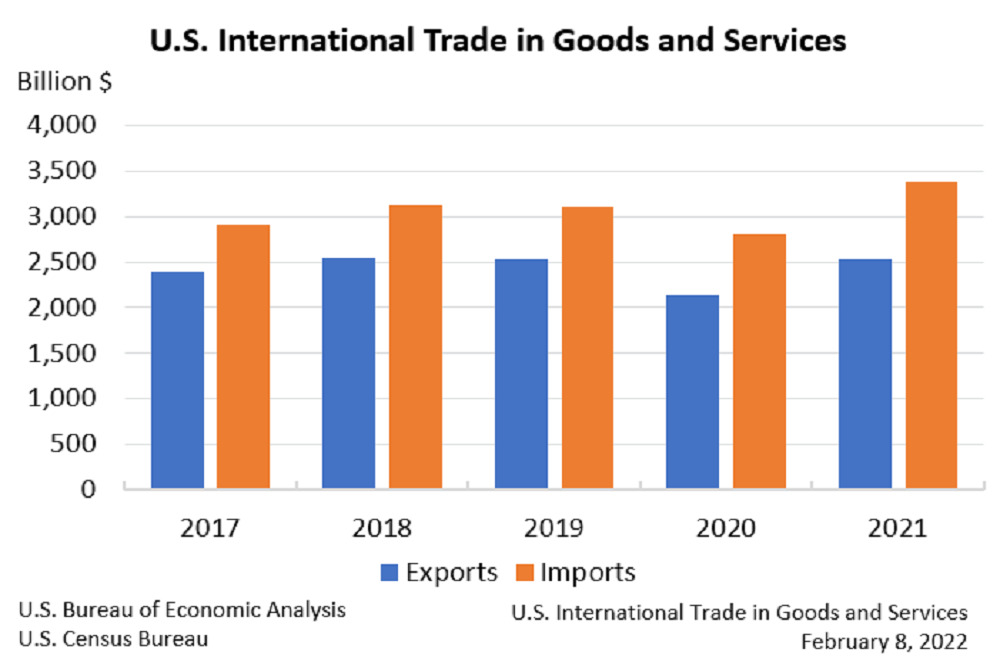
For 2021, the goods and services deficit was $859.1 billion, up $182.4 billion from $676.7 billion in 2020. Exports were $2,528.5 billion, up $394.1 billion from 2020. Imports were $3,387.7 billion, up $576.5 billion from 2020.
The 2021 increase in the goods and services deficit reflected an increase in the goods deficit of $168.7 billion, or 18.3 percent, to $1,090.7 billion and a decrease in the services surplus of $13.8 billion, or 5.6 percent, to $231.5 billion.
The goods and services deficit was 3.7 percent of current-dollar gross domestic product in 2021, up from 3.2 percent in 2020.
Exports (exhibits 3, 6, and 7)
Exports of goods increased $333.2 billion to $1,762.0 billion in 2021.
Exports of goods on a Census basis increased $329.6 billion.
- Industrial supplies and materials increased $169.6 billion.
- Other petroleum products increased $25.2 billion.
- Natural gas increased $21.2 billion.
- Crude oil increased $19.9 billion.
- Capital goods increased $59.3 billion.
- Other industrial machinery increased $11.1 billion.
- Semiconductors increased $11.0 billion.
- Civilian aircraft increased $7.7 billion.
- Consumer goods increased $47.3 billion.
- Pharmaceutical preparations increased $24.1 billion.
- Cell phones and other household goods increased $5.9 billion.
- Gem diamonds increased $5.0 billion.
- Foods, feeds, and beverages increased $25.9 billion.
- Automotive vehicles, parts, and engines increased $15.7 billion.
Exports of services increased $60.9 billion to $766.6 billion in 2021.
- Other business services increased $26.8 billion.
- Financial services increased $17.7 billion.
Imports of goods increased $501.8 billion to $2,852.6 billion in 2021.
Imports of goods on a Census basis increased $497.0 billion.
- Industrial supplies and materials increased $169.7 billion.
- Crude oil increased $56.3 billion.
- Other petroleum products increased $18.2 billion.
- Iron and steel mill products increased $14.2 billion.
- Consumer goods increased $126.8 billion.
- Cell phones and other household goods increased $22.9 billion.
- Toys, games, and sporting goods increased $16.7 billion.
- Cotton apparel and household goods increased $11.3 billion.
- Capital goods increased $117.5 billion.
- Electric apparatus increased $16.2 billion.
- Computer accessories increased $12.9 billion.
- Medical equipment increased $12.3 billion.
- Semiconductors increased $11.1 billion.
- Automotive vehicles, parts, and engines increased $36.8 billion.
- Other automotive parts and accessories increased $20.8 billion.
- Foods, feeds, and beverages increased $27.8 billion.
Imports of services increased $74.7 billion to $535.0 billion in 2021.
- Transport increased $32.1 billion.
- Travel increased $22.0 billion.
The 2021 figures show surpluses, in billions of dollars, with South and Central America ($53.6), Hong Kong ($25.8), Netherlands ($18.2), Brazil ($15.6), Australia ($14.0), and Belgium ($12.7). Deficits were recorded, in billions of dollars, with China ($355.3), European Union ($219.6), Mexico ($108.2), Germany ($70.1), Japan ($60.2), Ireland ($60.2), Canada ($49.5), Malaysia ($41.0), Taiwan ($40.2), Italy ($39.3), Switzerland ($39.0), Thailand ($34.7), India ($33.1), South Korea ($29.2), Russia ($23.3), France ($20.3), and Indonesia ($17.6).
- The deficit with China increased $45.0 billion to $355.3 billion in 2021. Exports increased $26.6 billion to $151.1 billion and imports increased $71.6 billion to $506.4 billion.
- The deficit with the European Union increased $35.4 billion to $219.6 billion in 2021. Exports increased $40.4 billion to $271.6 billion and imports increased $75.8 billion to $491.3 billion.
- The deficit with Switzerland decreased $17.8 billion to $39.0 billion in 2021. Exports increased $5.9 billion to $24.0 billion and imports decreased $11.9 billion to $63.0 billion.