Total Transborder Freight by Border in August 2022, Compared to August 2021:Transborder freight between the U.S. and North American countries (Canada and Mexico) in August 2022:
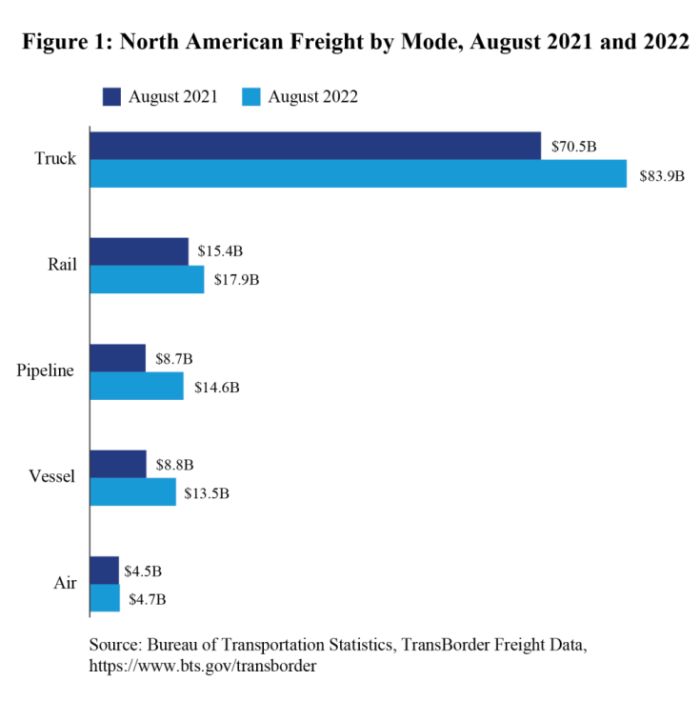
- Total transborder freight: $140.3 billion of transborder freight moved by all modes of transportation, up 24.1% compared to August 2021
- Freight between the U.S. and Canada totaled $70.0 billion, up 23.3% from August 2021
- Freight between the U.S. and Mexico totaled $70.3 billion, up 24.9% from August 2021
- Trucks moved $83.9 billion of freight, up 19.0% compared to August 2021
- Railways moved $17.9 billion of freight, up 15.9% compared to August 2021
Total Transborder Freight by Border and Mode:
U.S.-Canada (both directions)(Dollars in Billions)Truck: $35.6 Rail: $10.1 Pipeline: $13.0 Vessel: $4.4 Air: $3.2 U.S.-Mexico (both directions)(Dollars in Billions)Truck: $48.3 Rail: $7.8 Vessel: $9.1 Pipeline: $1.7 Air: $1.5
The value of oil increased by 38.3% in August 2022 compared to August 2021, and 121.2% compared to August 2020. (1)(2) Chicago, Port Huron, and Minneapolis are the top pipeline connection regions for U.S. energy fright flows with Canada. El Paso, Hidalgo, and Laredo are the top pipeline connection regions for the Southern border.
| U.S.-Canada Trade Breakdown | U.S.-Mexico Trade Breakdown |
| Top three truck ports | Top three truck ports |
| Detroit, MI $10.0 billion | Laredo, TX $21.9 billion |
Port Huron, MI $6.0 billion | El Paso-Ysleta, TX $6.7 billion |
| Buffalo, NY $5.9 billion | Otay Mesa, CA $5.2 billion |
| Top three truck commodities | Top three truck commodities |
| Computers/parts $5.8 billion | Computers/parts $10.1 billion |
| Vehicles/parts $5.0 billion | Electrical machinery $10.6 billion |
| Electrical machinery $2.3 billion | Vehicles/parts $6.6 billion |
| Top three rail ports | Top three rail ports |
| Port Huron, MI $2.3 billion | Laredo, TX $4.3 billion |
| Detroit, MI $2.3 billion | Eagle Pass, TX $2.1 billion |
| Int’l Falls, MN $1.4 billion | El Paso, TX $0.6 billion |
| Top three rail commodities | Top three rail commodities |
| Vehicles/part $3.2 billion | Vehicles/parts $3.5 billion |
| Mineral fuel $1.1 billion | Computers/part $0.6 billion |
| Wood products $0.7 billion | Plastics $0.4 billion |
Reporting NotesData in this Bureau of Transportation Statistics release are not seasonally adjusted and are not adjusted for inflation. For previous statistical releases and summary tables, see transborder releases. See transborder freight data for data from previous months, and for additional state, port, and commodity data. BTS has scheduled the next release of transborder numbers for November 18, 2022.
Original source can be found here.